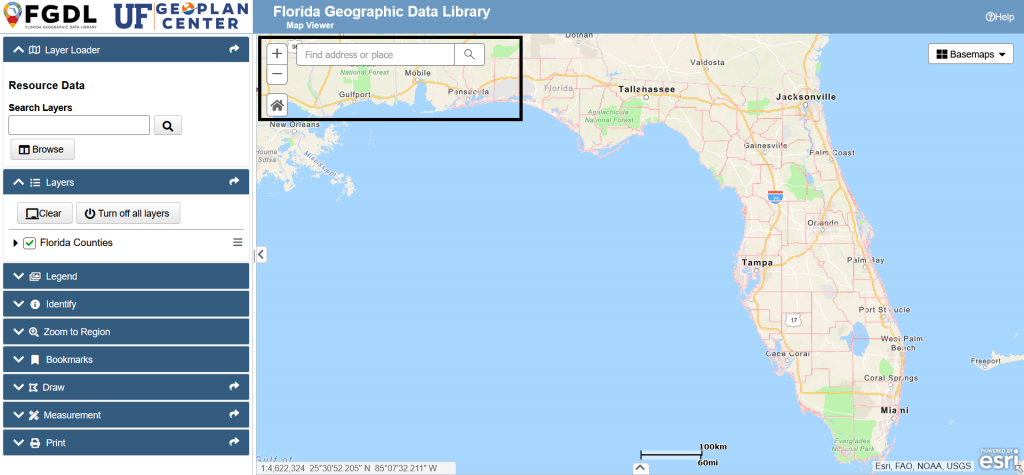
There are several map navigation tools in the top left corner of the map.
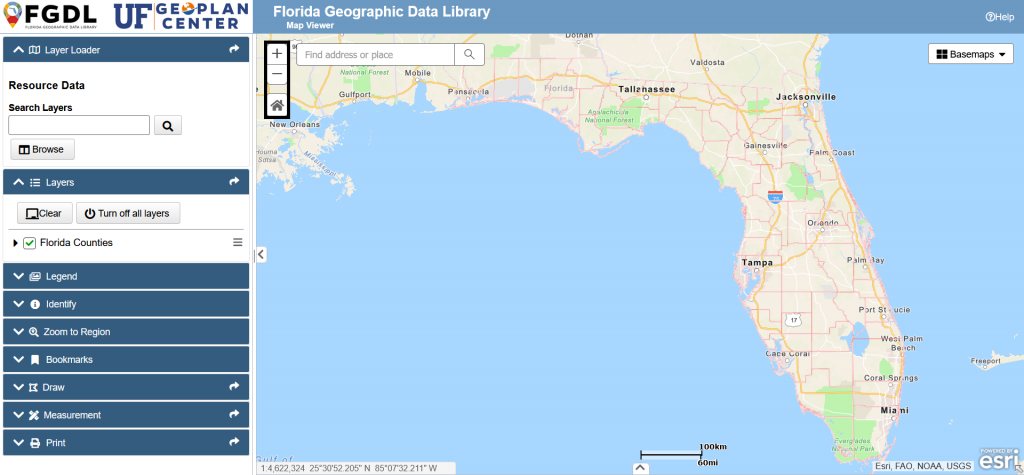
First, there is a vertical row of navigation buttons, including:
- Zoom In,
- Zoom Out,
- and Home,
which returns to the default extent, which includes the entire state of Florida.
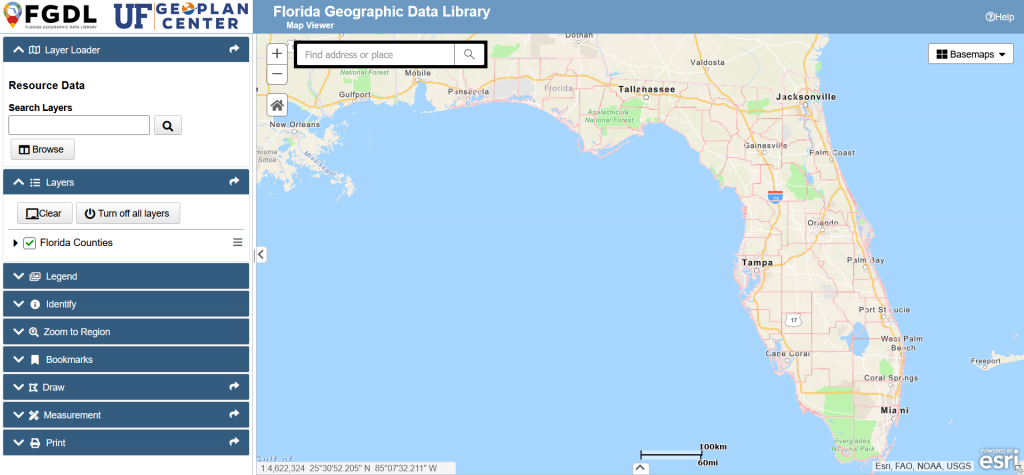
You can also search by location.
The location can be large, like a county, or small, like an address, but it should be specific.
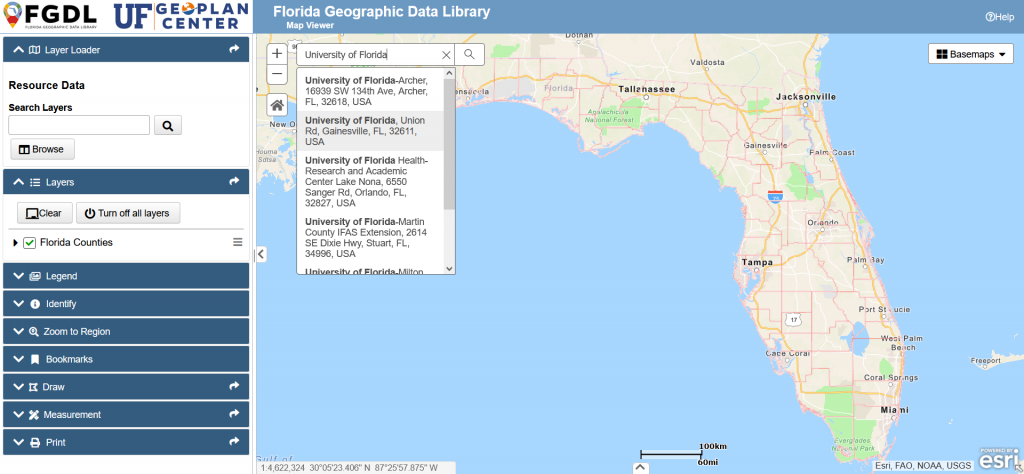
As you type the search, a list of locations will appear below the search bar. If you see the one you’re looking for, select it. If not, press enter when you’ve finished typing in your search.
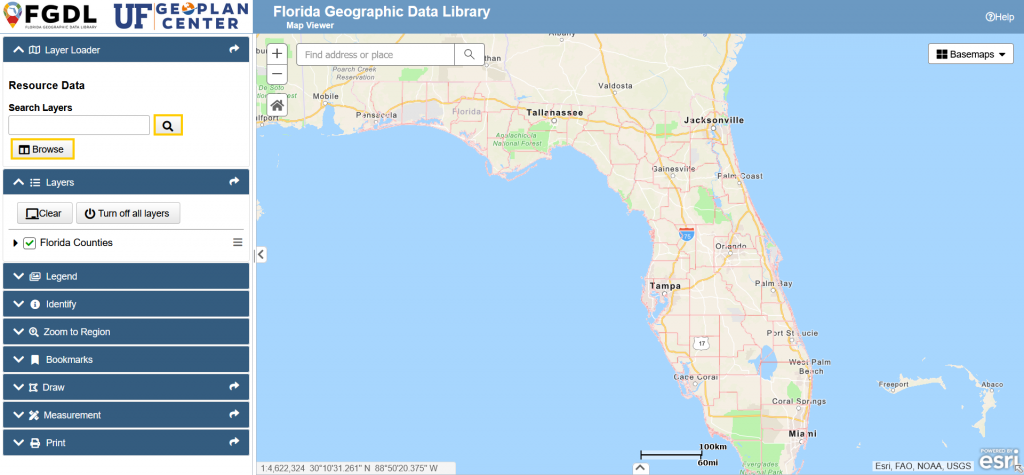
You can add data to the FGDL Explorer via either browsing or searching.
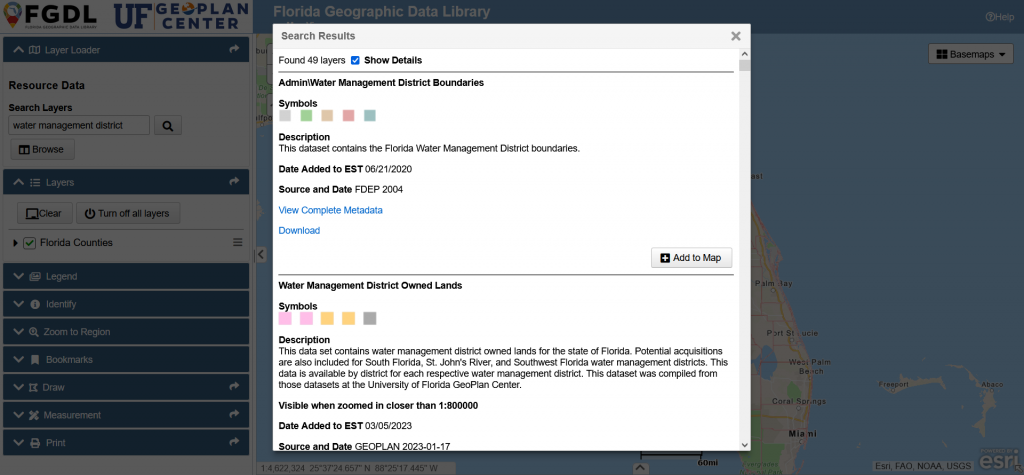
The Search function will search by the layer name and description. It’s an especially useful tool if you’re looking for a particular layer, or trying to find if the Explorer has data on a certain subject.
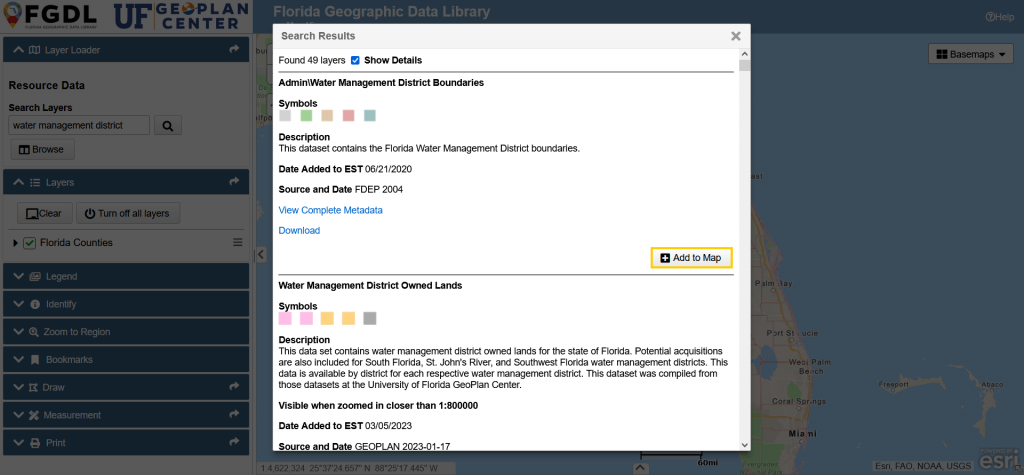
To add data to the Explorer, click the Add to Map button at the bottom right corner of the data description.
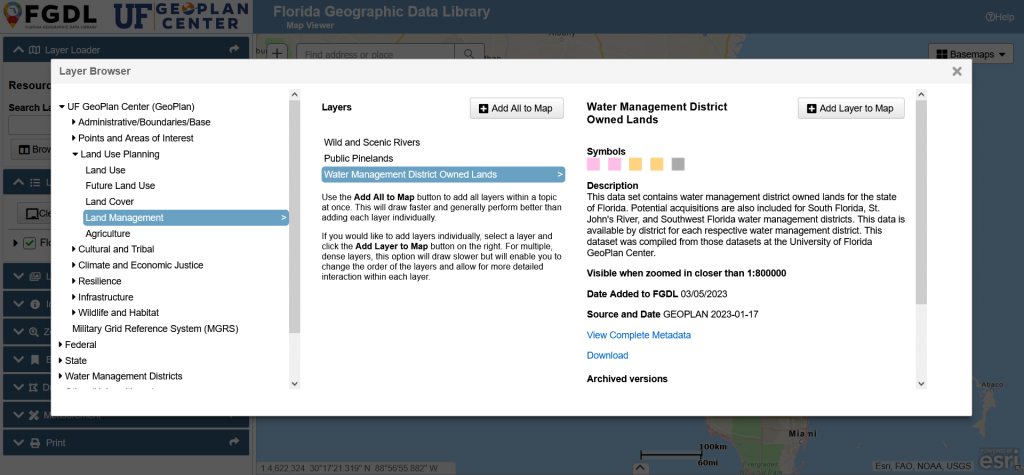
The Browse function opens the Layer Browser, where data layers are organized by topic (major data sources). You can click on a topic to see a list of sub-topics available. This is a great way to get a sense of what data is available on the Explorer.
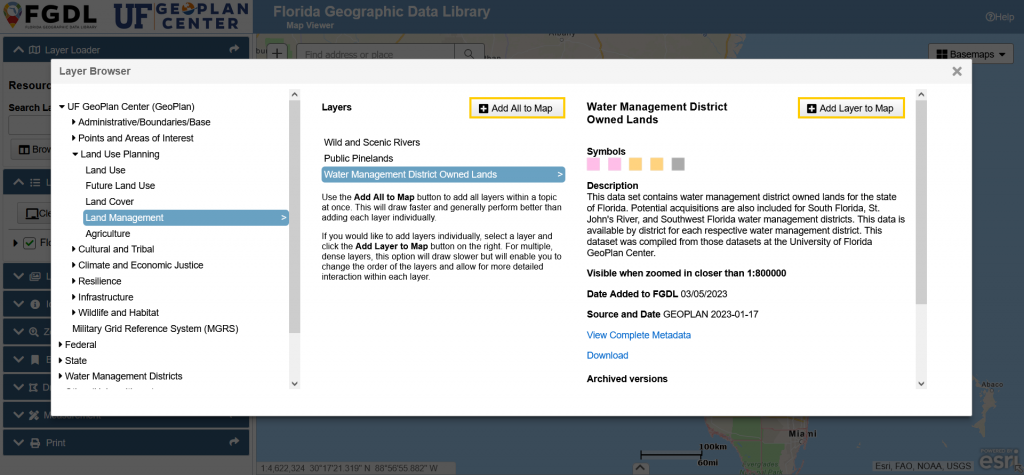
To add data to the Explorer, you can either click Add All to Map to add all layers within a subtopic, or Add Layer to Map to add a single, selected layer.
If you want to learn more, or see search and browse in action, watch the video tutorial on the left (1:50).
If you are having issues loading the video, you can watch directly on YouTube.
See the video tutorial to the left to learn about layers in the map viewer (1:55).
If you are having issues loading the video, you can watch directly on YouTube.
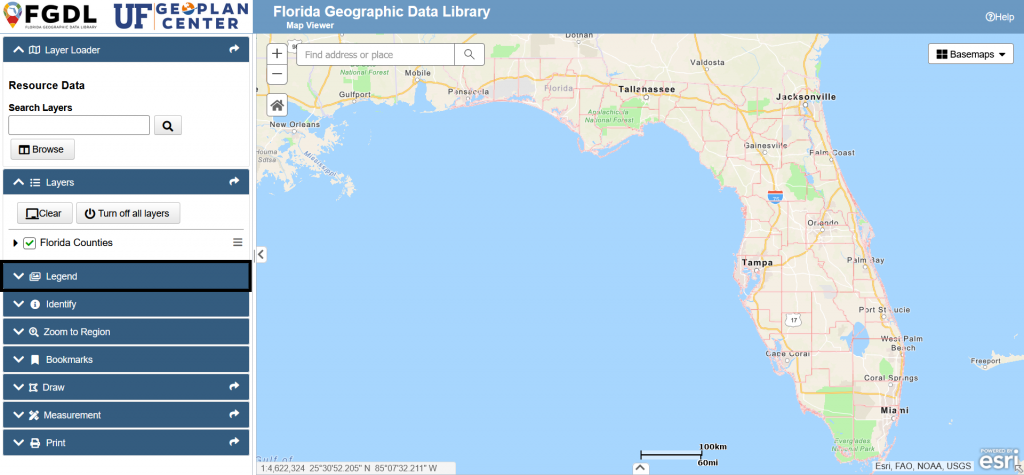
To view the legend, expand its widget by clicking on the label.
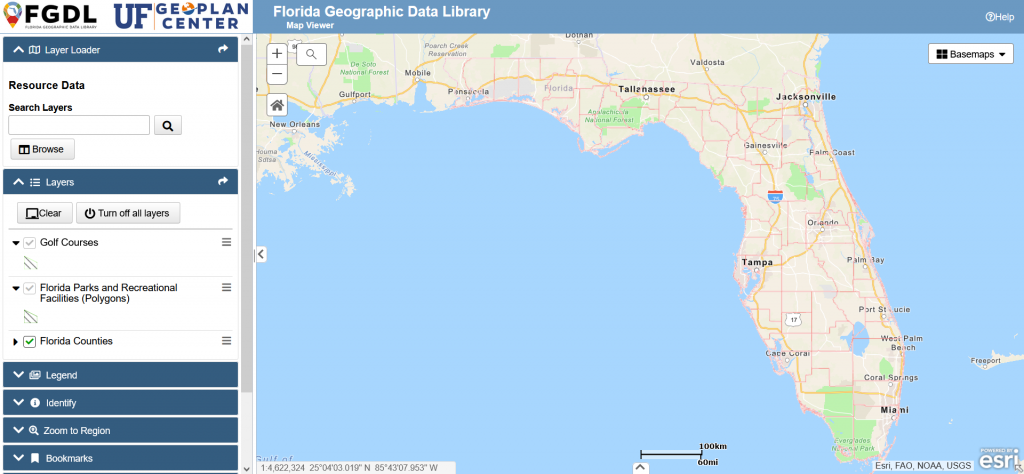
When you add a layer to the explorer, the legend will be updated accordingly.
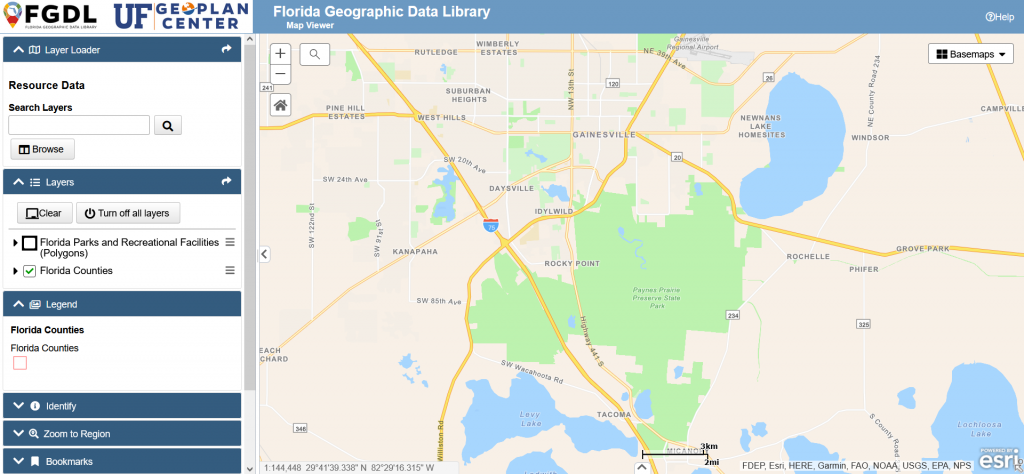
Turning off a layer will remove it from the legend, even if you haven’t removed it from the map.
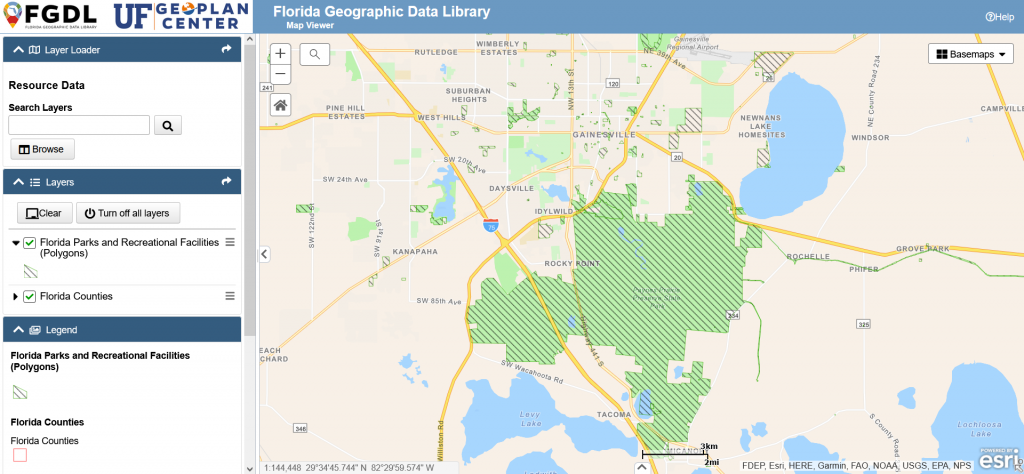
You can also view the symbology for a given layer by expanding it from the layer list. Simply click the arrow next to the layer name.
See the video tutorial to the left for how to access the attribute table (1:55).
If you are having issues loading the video, you can watch directly on YouTube.
Watch the video tutorial to the left to learn how to use the FGDL Explorer to download data, view metadata, and download archived versions of data (1:02).
If you are having issues loading the video, you can watch directly on YouTube.
The FGDL Explorer sidebar is divided into features called widgets.
Watch the video tutorial to the left to learn how to adjust widgets in the FGDL Explorer (0:52).
If you are having issues loading the video, you can watch directly on YouTube.
Watch the video tutorial to the left to learn how to use the Identify tool in the FGDL Explorer (1:07).
If you are having issues loading the video, you can watch directly on YouTube.
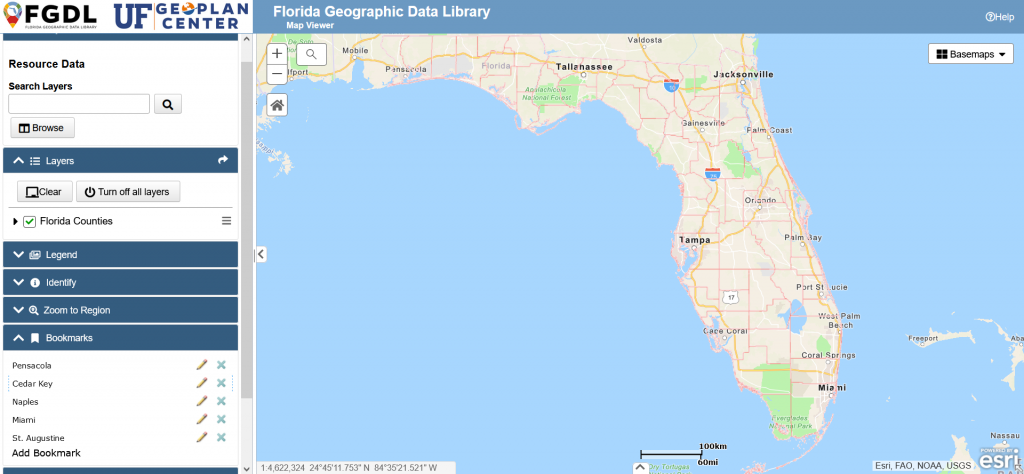
The Bookmarks Widget allows you to save a specific extent, so you can easily return to that location and level of zoom.
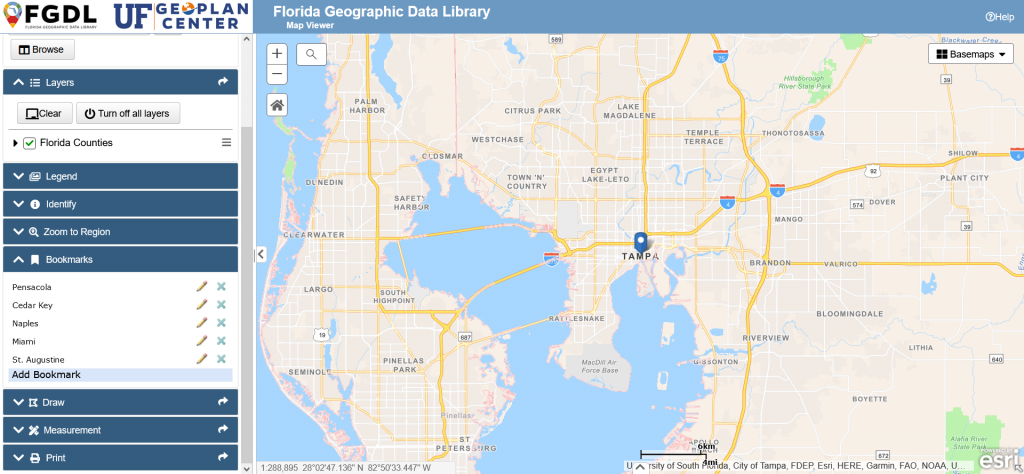
To use the Bookmark Widget, first navigate to where in the map you’d like to bookmark. Open the Bookmark Widget on the sidebar and select Add Bookmark.
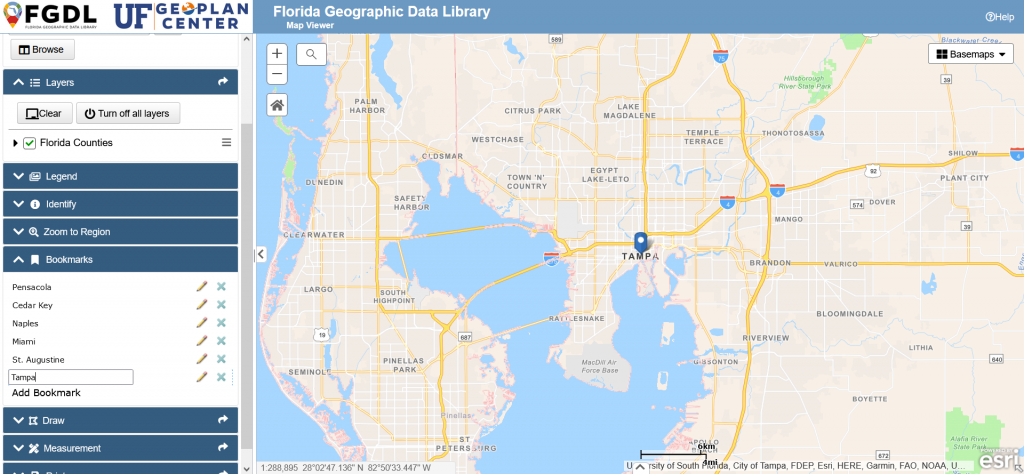
Type in what you’d like to name it. If you want to adjust the title, click on the pencil icon and rename it.
From there, navigate across the map.
Click the bookmark to be zoomed back to the location.
You can delete the bookmark by clicking on the X button. The bookmarks are stored in your browser cache and will be saved until you clear your cache.
If you are having issues loading the video, you can watch directly on YouTube.
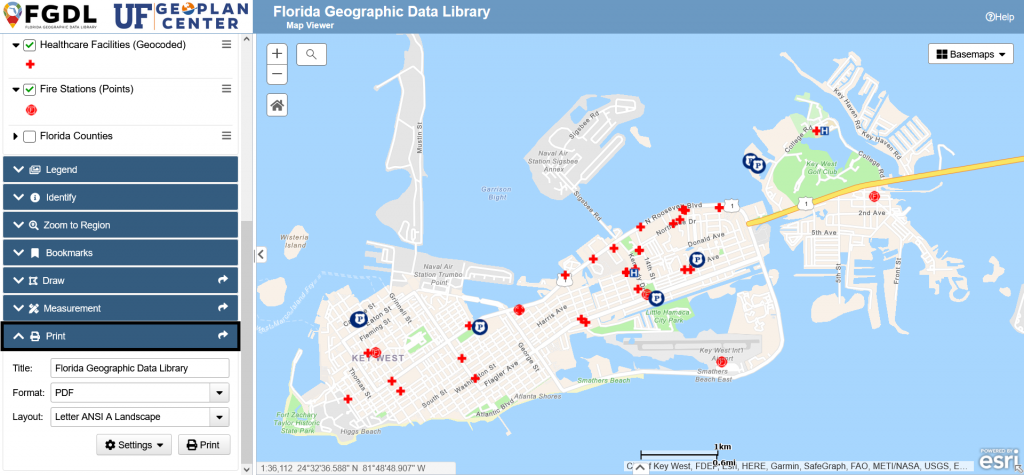
The FGDL Explorer allows you to save a map, which will include all the layers you currently have turned on in the map.
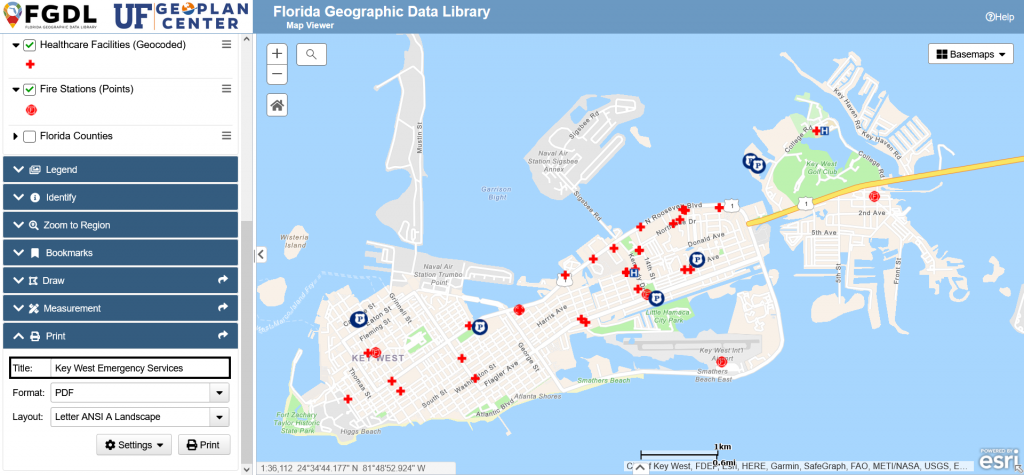
First, enter a title for the map.
Second, choose an output format type (PDF or several image formats).
Third, choose a layout orientation and paper size.
By default, the map will include a title, date, scale bar, and legend. If you don’t want these included, choose the MAP_ONLY layout option.
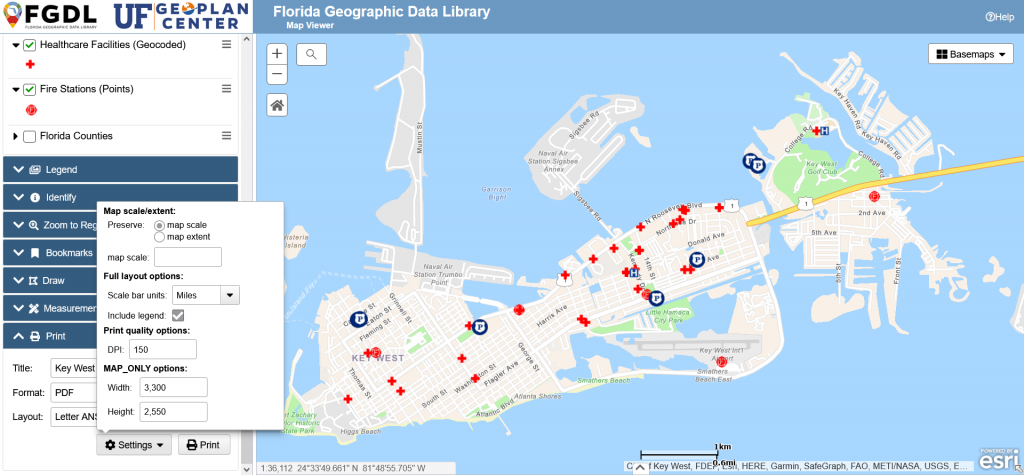
There are more options you can adjust in Settings.
You can choose to preserve either the Map Extent (as shown in the viewer) or the Map Scale (to make your exported map share the same zoom level as the map in the viewer).
You can also choose the scale bar units, turn off the legend, and adjust the DPI. Finally, if you’re choosing the MAP_ONLY Layout, you can adjust the width and height manually.
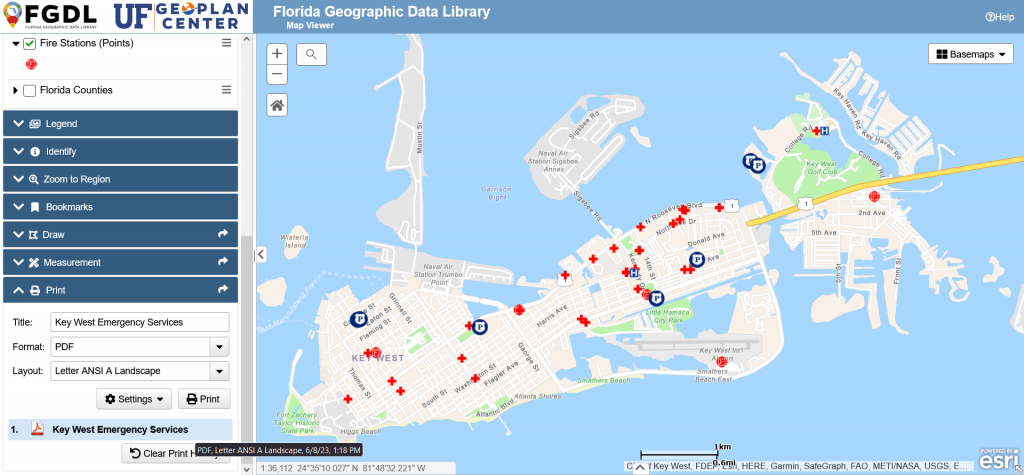
When you’ve configured your settings, press the Print button.
Once completed, you can download the map by clicking on its name (displayed below the settings and print buttons).
You can generate multiple maps, but avoid creating multiple prints in short succession. Wait about a minute before printing each map.
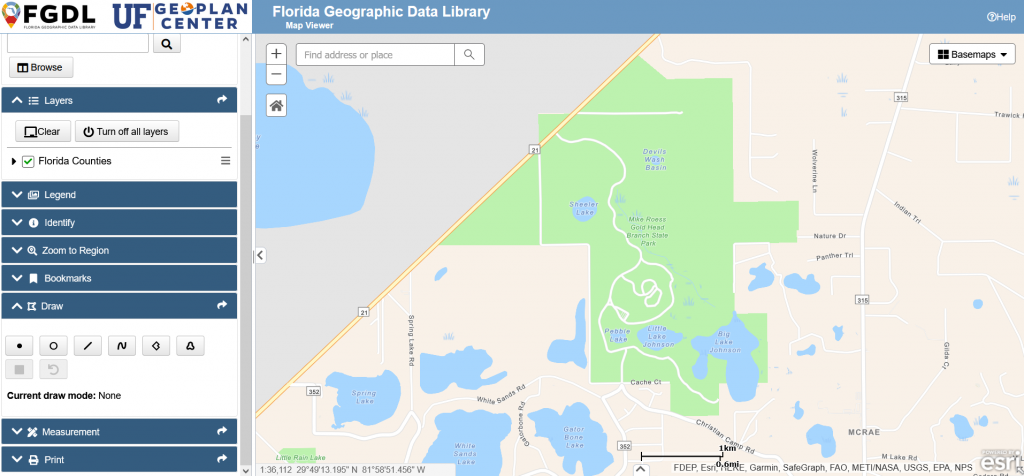
The Draw Widget allows you to draw directly on the map. Open up the widget from the sidebar and select which type of shape you’d like to draw:
- Point
- Circle
- Polyline
- Freehand Polyline
- Polygon
- Freehand Polygon
You can begin drawing on the map with a left-click.
As you mouse over the map, pop-ups will appear to give you specific instructions about how to manage the shape tool you’ve selected.
If you are having issues loading the video, you can watch directly on YouTube.
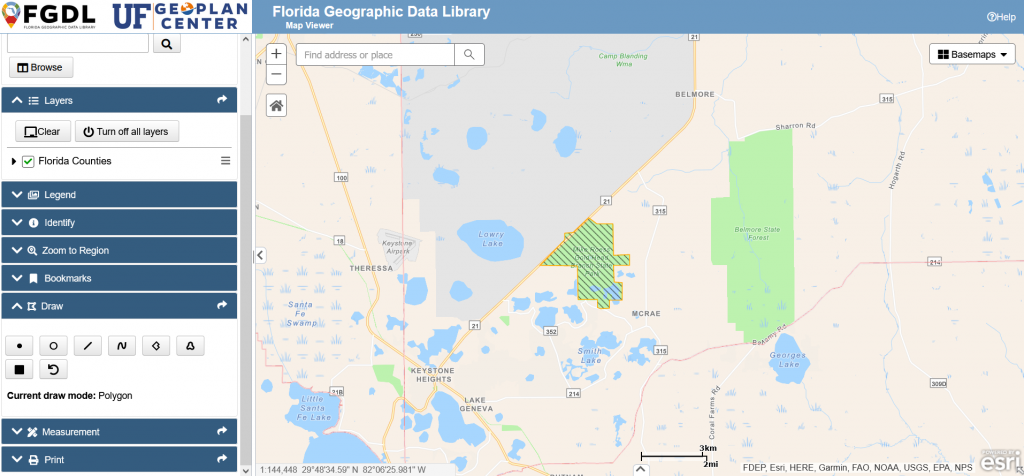
Exit the drawing mode by clicking on the Stop Drawing button (the black square).
The drawings will remain on screen as you navigate around the map.
You can clear the drawings by refreshing the page or clicking the clear drawing button (circular arrow). Please note that this will clear all drawings on the page.
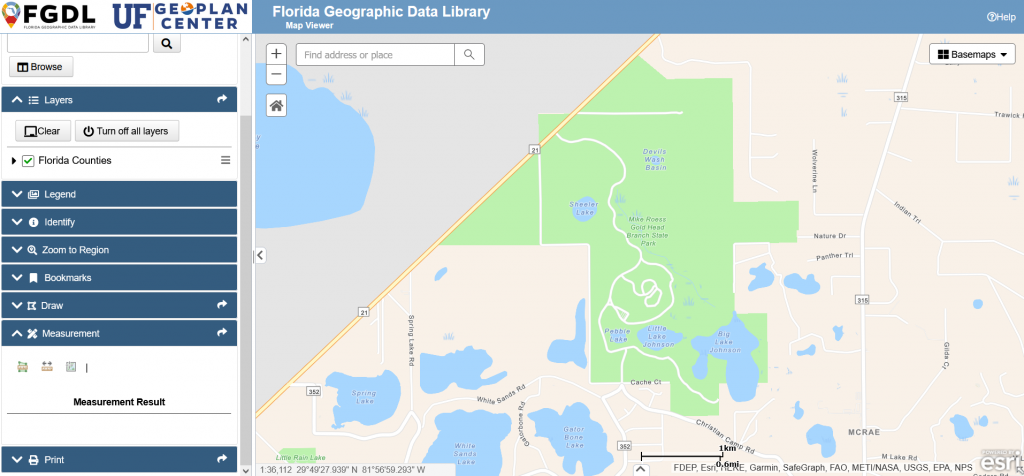
The Measurement Widget allows you to measure distance and area.
To measure area, click on the Area button (far left) and then select the desired units (to the right of the buttons). Then draw the area you want to measure by clicking and placing vertices on the map.
After three points have been placed on the map, the tool will automatically fill in the area and display the measurement result in the widget. However, you can include more than three points. Double-click to finish drawing.
After you’ve finished your shape, make note of the measurement result. Once you click on the map again, the shape and result will be cleared.
If you are having issues loading the video, you can watch directly on YouTube.
To measure length, click on length button (in the center). To the right, you can select the unit of measurement.
Click wherever on the map you’d like to begin your measurement. Continue to click the points along the length you’re trying to measure.
After two points have been placed on the map, the tool will automatically generate a measurement result in the widget. However, you can keep adding points. Double-click to finish drawing.
To clear the measurement line, click anywhere else on the map.
If you are having issues loading the video, you can watch directly on YouTube.
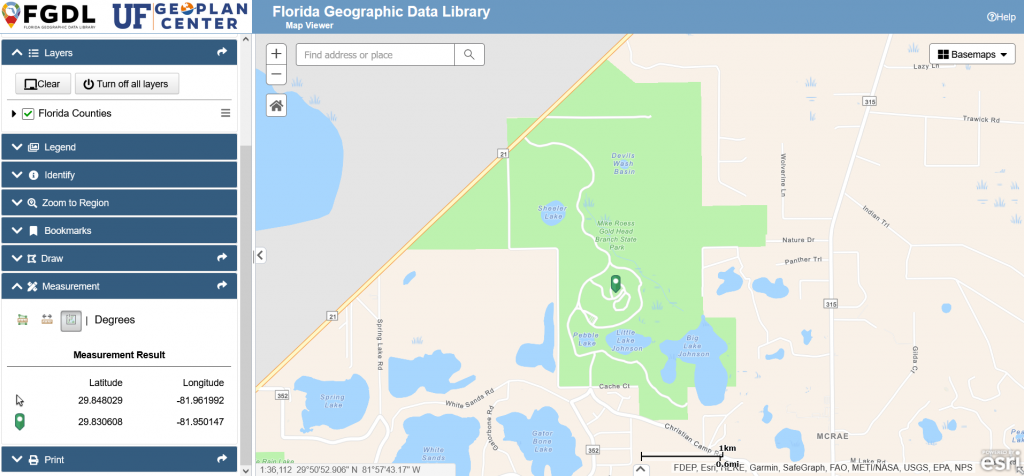
Finally, you can determine the location of a point on the map in one of the following systems:
- Degrees
- DMS (Degrees Minutes Seconds)
- MGRS (Military Grid Reference System)
- USNG (United States National Grid)
- UTM (Universal Transverse Mercator)
- GeoRef (World Geographic Reference System)
- GARS (Global Area Reference System)
Select the system you would like to use, then click on a point on the map. Its location will be generated under measurement results.
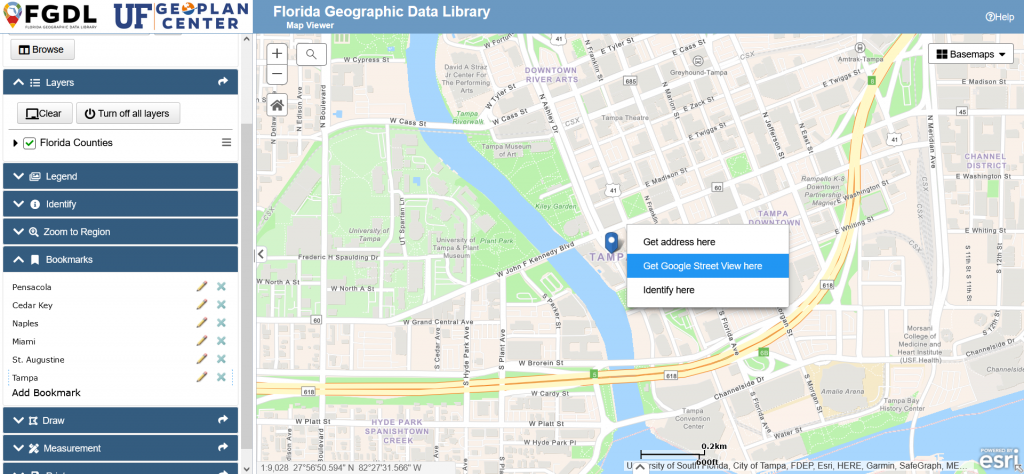
To open Google Street View, right click on the map and select Get Google Street View here.
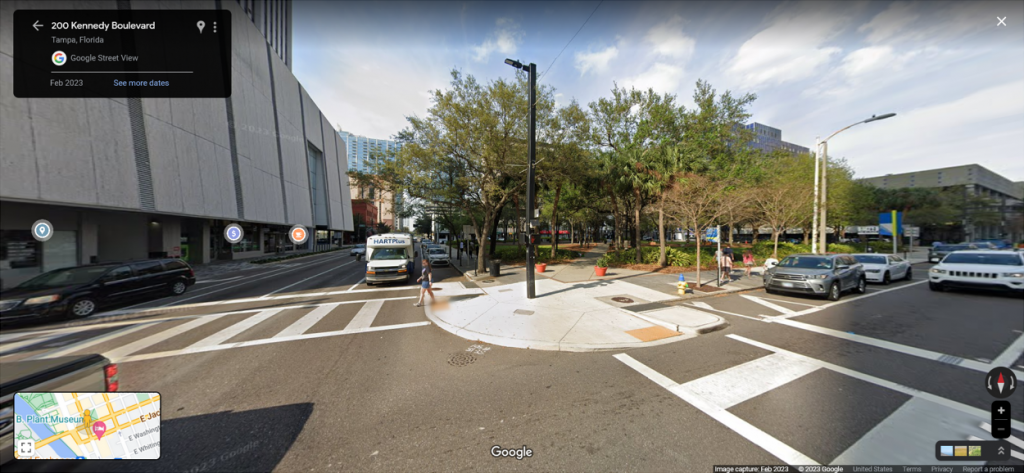
A new tab will open, showing the same location on Google Street View.
If Google Street View is not available at that location, the tab will open with a black screen.
It is often easier to find a valid Google Street View location when zoomed in further on the map, so you can be more precise in where you click on the map. Clicking directly on streets will produce the best results.
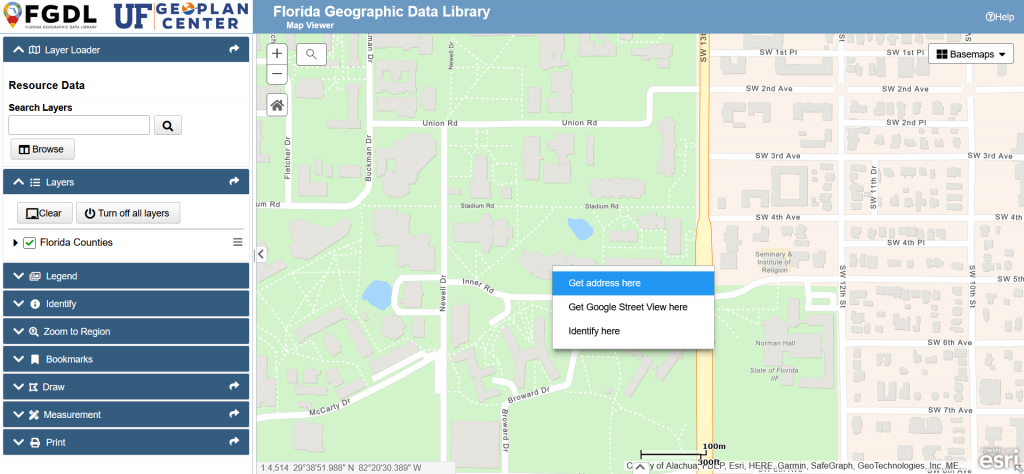
You can determine the address of a location on the map by right clicking and selecting Get Address.
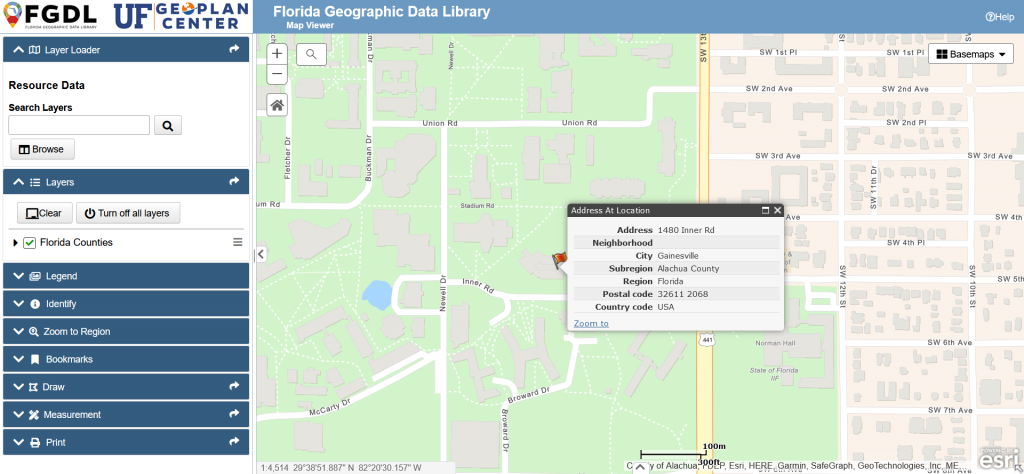
A pop-up will open listing address, neighborhood, city, subregion, region, postal code, and country.
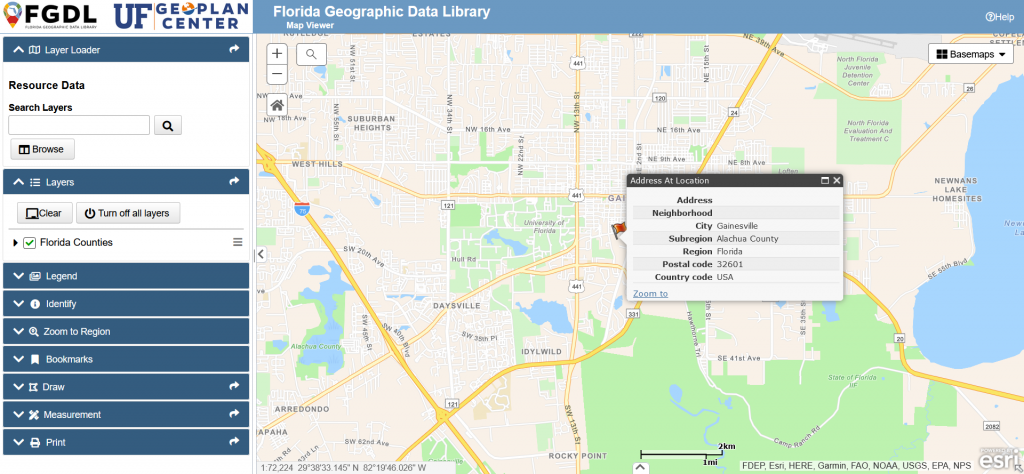
Not every category will be filled. Most commonly, the neighborhood will be missing, but you may also click on a space that doesn’t have something for the address field. To get the best results, zoom in on the map close enough to click on specific streets or buildings.

